RPS Tracker is transforming load-and-haul earthworks for Civil Construction, Mining, & Environmental Remediation projects with Earthmoving Intelligence™.
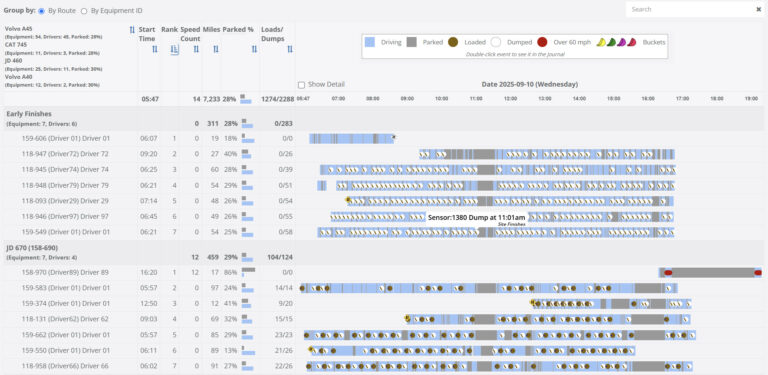
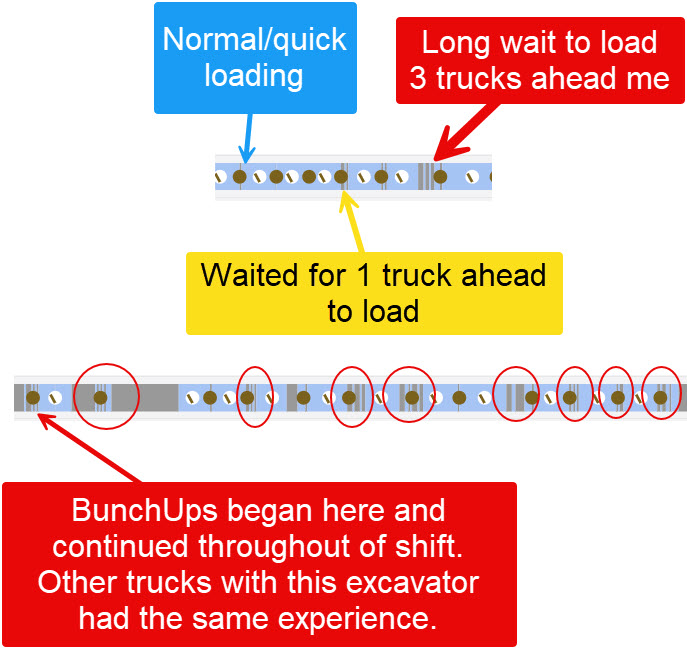
Unlike traditional telematics systems that only track machines and loads, RPS Tracker provides a comprehensive view of every machine, truck, and operator. Our platform delivers real-time insights into operator performance, cycle times, and material movement... empowering you to make data-driven decisions that eliminate inefficiencies, boost productivity, and maximize profitability across your projects.
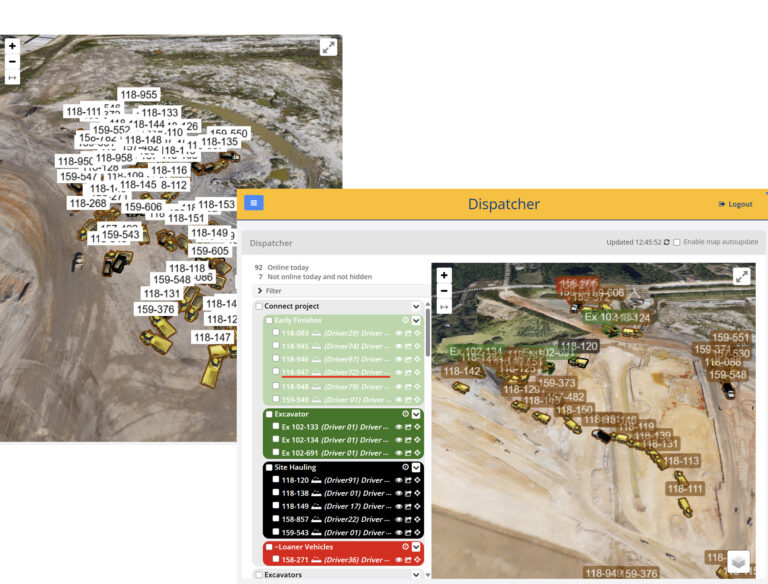
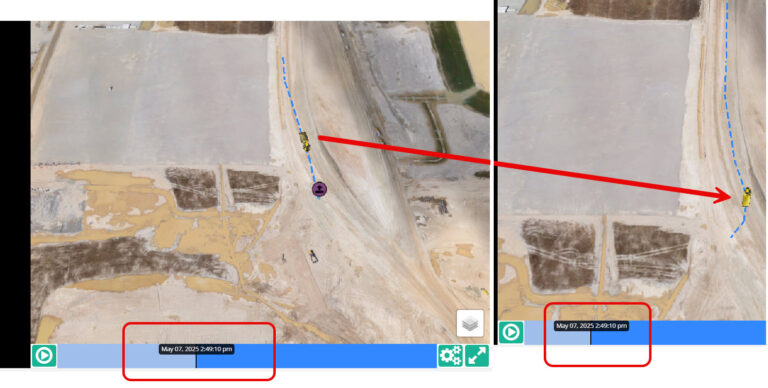
With RPS Tracker, your operational data is seamlessly connected to a digital map, giving you a real-time, actionable picture of your entire site. From tracking material placement to monitoring driver performance, RPS Tracker provides the insights and recommendations you need to keep your projects on time and on budget - no matter where you are.


 Skip to content